Blog Post #15
The past cannot be changed…
…the future is yet in your power.

6th April 2021 marks 4 years since Edgecumbe failure
On this day 4 years ago the Rangitāiki River breached the floodbank and floodwall at College Road in Edgecumbe, causing the destruction of 15 homes and extensive damage to approximately 250 other properties. Whilst fortunately there was no loss of life, there was significant disruption to those residents affected. Days before this event, Cyclone Debbie had been tracking it’s way in a south easterly direction from Australia, having caused widespread flooding and damage in Queensland and New South Wales, which unfortunately did involve the loss of life. At the same time Cyclone Debbie made her way across the Tasman, a frontal system moved north-eastwards across New Zealand, until the two weather systems met over the central North Island. Following this came several days of heavy rain and in combination with above average levels of soil saturation due to a very wet March, the Rangitāiki (and Whakatāne) river experienced abnormally high river levels, which was one component contributing to the failure of the College Road floodbank.
Following the flood event, the Bay of Plenty Regional Council commissioned an independent review to provide answers about what happened and why. You can access the report based on the independent review here: https://cdn.boprc.govt.nz/media/681909/2017-10-03-rrsr-final-report-public.pdf, where you will find more detail on the Rangitāiki River, the 6th April flood event, and in-depth discussions on the likely reasons why the failure occurred.

If you read the report (Section 4) you will understand that the review identified a number of causes that likely contributed to the failure of the scheme, which largely centres around a build up of pore water pressure that ultimately led to failure of the College Road floodwall and subsequent flooding of the properties and land behind.
Now today, as I stand at the location of the failure, a new stopbank lies here along the river, protecting the properties and population that live behind.
Could another floodbank failure occur somewhere else in the scheme? Where could it occur? When could it occur? How could it occur? The rest of this blog post will explore some of these questions, while focusing on the importance of not just collecting asset condition information, but how it is used and presented.

Why it’s so important to collect asset condition data
Section 5 of the aforementioned report goes on to discuss whether the failure could have been avoided, with reference made to the operation of the Matahina Dam, the Reid’s floodway, and evacuation planning. The reader is directed to the report to learn more about these. I personally notices little mention of the importance of collecting asset condition information, most likely because the failure was attributed to sub-surface geotechnical issues that may not have been clearly visible to the naked eye. However, and more generally, I would like to reiterate the importance of collecting asset condition information, and how it can be used to identify geotechnical issues.
There may be assumptions that a visual and non-intrusive physical condition assessment will not identify subterranean, geotechnical and intrinsic strength issues. It is indeed possible to miss or not identify geotechnical issues that are not visible to the eye, however there are certainly performance features related to failure modes that can be identified during visual conditions assessments that may indicate an internal issue within the floodbank (or other asset). Typically these will then trigger further and more intrusive investigations. After all, is it fiscally responsible or practical to commission intrusive, geotechnical investigations along hundreds of kilometres of floodbank? Certainly not. The rest of this section will discuss the importance and benefits of collecting asset condition information.
What are the benefits of collecting condition information?
In addition to the aforementioned and obvious reason above, that it is far less expensive to visually inspect say 100m of floodbank than undertake 100m of geotechnical investigations, there are a number of other reasons why it is important and beneficial to collect asset condition data. Some of these are outlined below.
- Engineering integrity performance issues
While visual condition assessments do not undertake intrusive investigations or involve the robust analyses compared to that of geotechnical investigations, they do have the ability to identify issues related to intrinsic strength which will then trigger further investigations. There are many multiple different ways a floodbank may fail which can make it quite intimidating for operational personnel undertaking inspections in the field as they try to identify potential failure modes. When I deliver asset inspection training to area engineers and operational personnel on inspecting flood protection assets, I try to take a clear and memorable approach. Yes, there are many ways the floodbank can fail, however all these failures can be attributed to TWO distinct groups: foundation failure OR stopbank failure. This starts to break down this complicated area into manageable pieces.

Furthermore, the most common modes of stopbank (floodbank) failure can largely be grouped into:
-settlement,
-instability,
-seepage; and
-erosion.
For example, the literature states (Morris et al., 2007) that failure relating to the foundation strata could potentially result in excessive settlement, deep seated slope instability, large scale lateral movement, excessive under seepage or hydraulic uplift pressures.
Whereas, failures stemming from the stopbank itself are identified as surface/toe erosion, excessive internal seepage and shallow slope instability.
Thus, by identifying the geotechnical processes outlined above that can relate to failure modes of the stopbank, it’s possible to identify the performance features that typically occur as a result of said failure modes. These ‘performance features’ can be identified during visual condition assessments. For example, with reference to the table in the image below (sorry for resolution!), identifying low crest levels in the field may indicate settlement issues. Or evidence of cracking, animal burrows or encroaching trees/vegetation, could be an indication that internal seepage of the stopbank could be an issue.
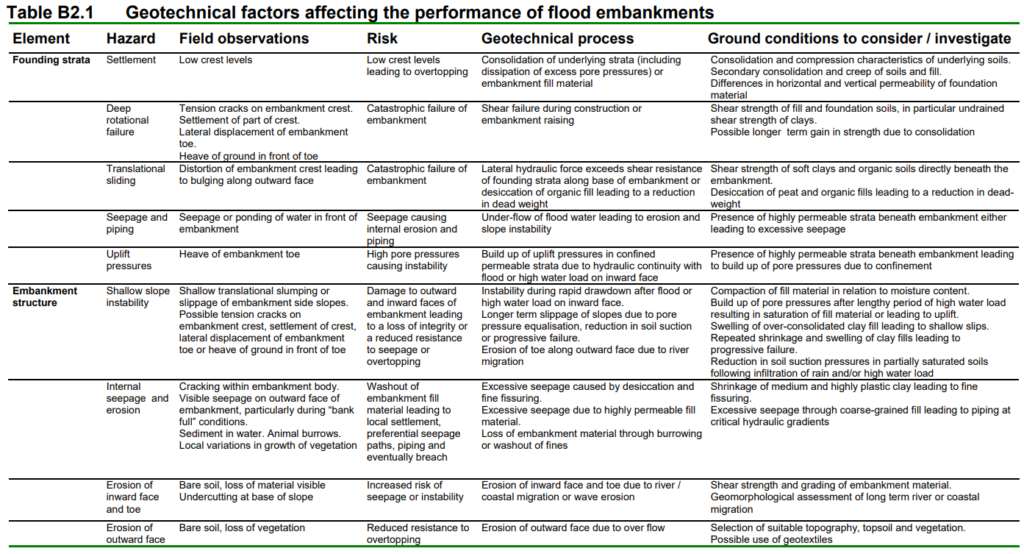
Therefore, by breaking the failure modes down into groups and highlighting specific performance features that relate to specific failure mode, operational personnel can focus on identifying the performance features in the field. This can be supported by using an asset inspection and condition rating guide that highlights the performance features that may be identified for varying condition grades for different assets.
2. Asset Performance
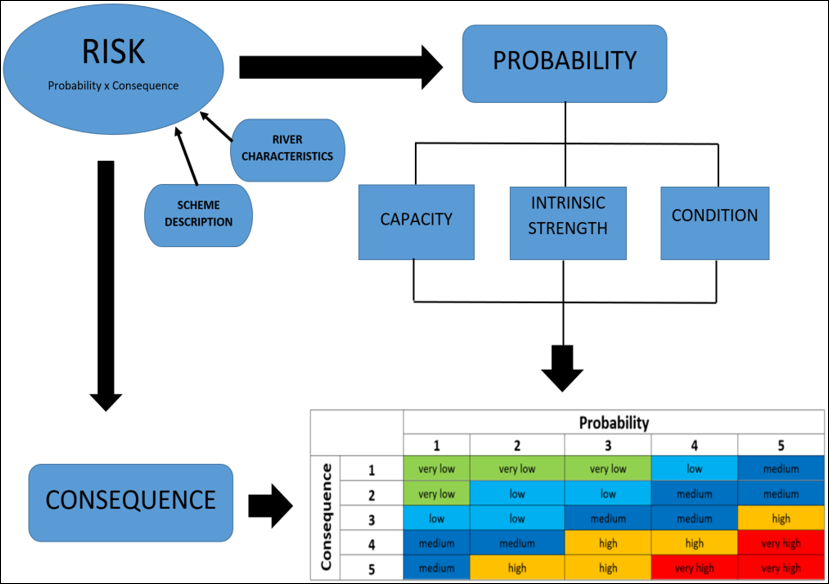
Another reason why it is important to collect asset condition information, particularly for flood protection assets, is related to its interdependence with asset performance. Around 2015, a National River Manager’s Special Interest Group, with support from Waugh Infrastructure, developed a national Code of Practice and supplementary (asset performance) tool to assess the performance of flood protection assets. The Code is a good practice guideline that provides a framework for assessing the performance of flood protection assets in a consistent manner across the country. A high-level, schematic breakdown of the risk-based framework is presented below. Note that condition forms a component of the performance assessment under probability of failure. In order to complete the assessment and work towards meeting this best practice framework, it is necessary that asset condition data is collected and used within the performance assessment.
3. Asset Deterioration Modelling
While this blog post does not delve into the depths of the detail in relation to asset deterioration modelling (refer references should you wish to), the post nonetheless wants to flash this on your radar. With respect to flood risk management, asset deterioration modelling ultimately involves the expected change in performance of a flood protection asset over time, using condition as proxy for performance. This change can be presented along a curve, where the axes are generally time and condition or performance. These curves can be used for developing maintenance regimes or whole life cost analysis. However, for these curves to work, condition information and historic trends needs to be available. This approach takes a more proactive angle by aiming to anticipate when an asset may change from moderate condition to poor and planning to prevent this, compared with the reactive approach of waiting for it happen and then potentially spending more money fixing it. Plan and prevent VS find and fix.
To my knowledge in New Zealand we are not close to this sophisticated level of flood risk asset management yet, but an important step towards this is consistently collecting asset condition information (amongst other data).
4. Evidence
In certain situations asset condition information can be a critical piece of evidence. For example, following a flood event an audit will likely be on the cards and this process will examine any and all information relating the assets within the scope of the audit. Having a consistent record of asset condition information that can be pulled up and reviewed will be beneficial to the audit process. In this instance, if no information is available there is risk of poor diligence for those involved. In another example, the community or any river scheme committee groups will expect to see evidence to justify annual scheme expenditure. Asset condition information could be used to not only show the current state of the river scheme, but trend information from previous years can provide assurance to ratepayers that money is being spent to improve and maintain the assets as can be seen by the improvement in asset condition, and if not, why. For this, a historic trend of condition information will be necessary.
5. Asset Management Planning
Whilst generally an umbrella term which all the previous discussion points could sit under, it certainly deserves its place in the post. Asset condition information is inexorably linked to asset management planning as it is a core component for monitoring and reporting on asset performance and managing risk, particularly around critical assets. Furthermore, in lieu of any accurate asset age information, a condition-based renewal approach may be used to develop asset renewal programmes, alongside developing maintenance plans based on asset condition and defect information. Agreed standards or service levels with the community may have led to developing technical levels of service using asset condition information and performance measures such as “the % of flood protection assets in Good – Very Good condition”.
These are but just a few examples of how consistently collecting and recording asset condition information on an ongoing basis is fundamental for flood risk asset management. So how can we encourage and facilitate this… – by providing an easy means of collecting that data!
How to collect asset condition data
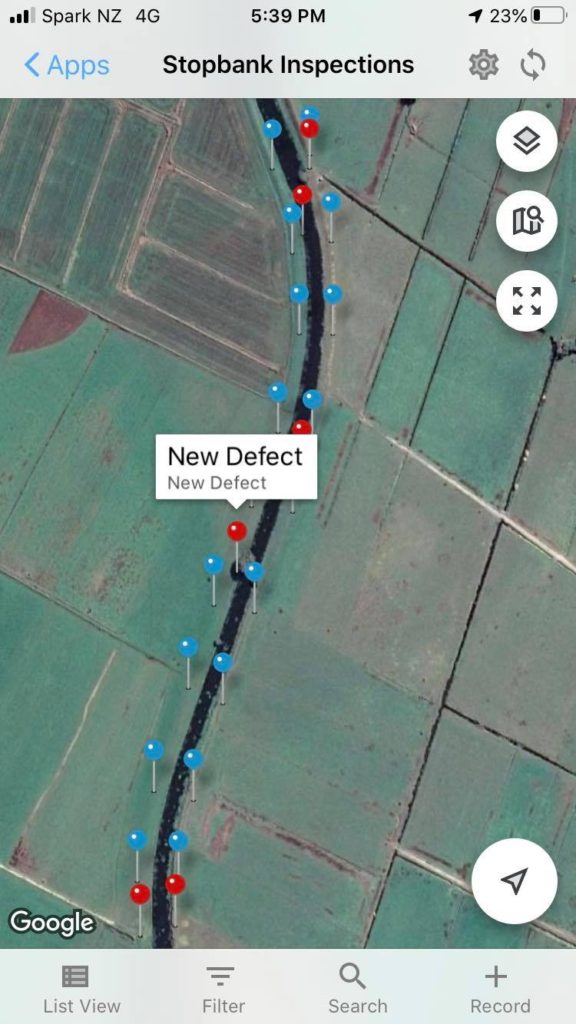
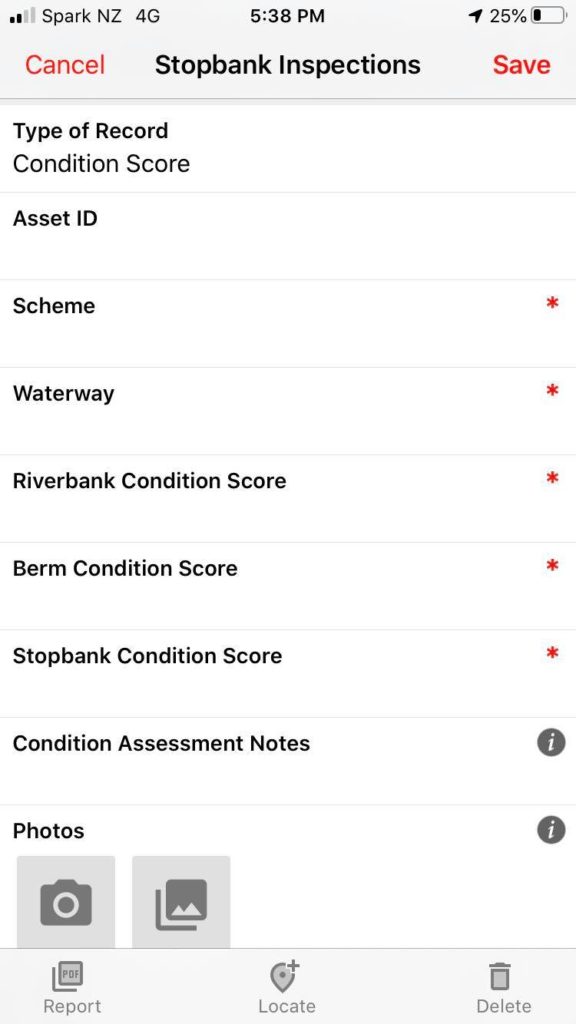
Across many Regional Council’s in New Zealand over the last 5 years or so there has been a shift away from paper-based data recording and carrying large laptops along rivers, towards mobile technology.
Mobile technology in the form of new apps are GPS-enabled and can store and update data ‘in the cloud’ and in real time. In my opinion, there is still more work to do to align data collection apps with asset information and financial management systems. However, I believe good progress is being made.
Most apps are very intuitive and user-friendly, and from my experience whilst there may be initial resistance to change from some individuals, once familiarised it is very quick to gain traction and ‘buy-in’. Although it goes without saying, any new products and technology needs to be rolled out in an appropriate way (e.g. transition phases) with necessary support, guidance and change management in place. Visual inspections are undertaken in the field and data recorded using an app supplemented by photographic evidence (OR DRONES!!).
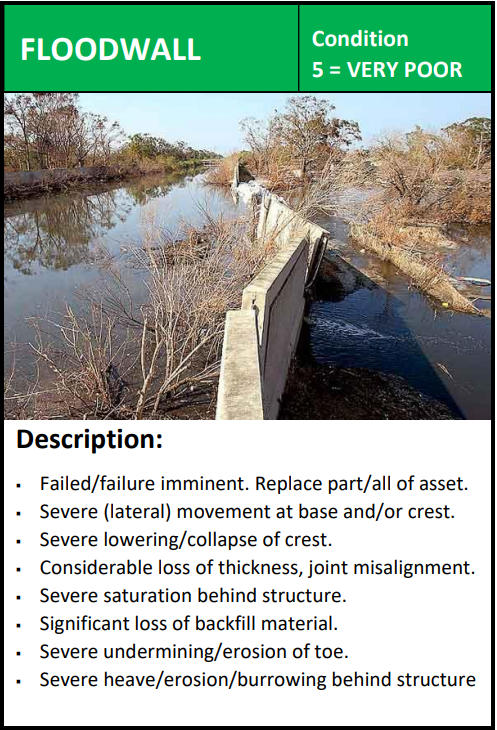
Aside from the process of recording data, how else should condition data be collected? As alluded to earlier, operational personnel will benefit from the availability of an asset inspection and condition rating guide that will help in assigning condition grades to various assets. A single source of information will facilitate consistency across multiple personnel undertaking inspections, especially in an area which will always have a degree of subjectivity involved. Inspection guides can be in hard-copy format and pocket-sized to practically carry in the field, or alternatively an electronic version can be used and accessed on the portable devices used for data recording (iPad, tablet, smart phone, etc).
So once you’ve collected the data, what do you do with it…
Presenting asset condition data
How do you analyse, report and present thousands of pieces of data in a way that is easy to read and understand? I started by using word reports and while this form was well accepted and considered the ‘traditional’ way of doing things, with technology advancing as it has done it was obvious there had to be another way. If you are savvy with excel you can certainly produce beautiful pivot tables and eye-catching reports, but there had to be something even better out there…and there is!
A former colleague of mine first introduced me to the capabilities of business intelligence software (shout out to Luke Turner), so after recently completing a contract where I myself had undertaken asset inspections along over 100km of floodbank and collected thousands of pieces of data (3343 to be exact!!), I decided to explore and experiment with some business intelligence software. Initially it seemed complex and intimidating, but soon after some tutorials and trial and error, it became very intuitive, and while I have only scratched the surface of the possible analyses available, it was certainly enough for my report.
So ultimately, I developed an interactive report with dashboard features that is far easier to navigate and play around with compared with the traditional word report. The dashboard also provides further benefits to more effectively assist with developing and tracking maintenance plans and programmes instead of drilling down into a large excel spreadsheet or similar. An interactive report can also be used as a tool for community and/or stakeholder engagement, or perhaps to present information to Council. So go check out some business intelligence software, it’s addictive!

So that brings me to the end of the post, I hope you found it worthwhile. I welcome any suggestions, questions, counter-thoughts. Bring them on 🙂
References:
Beever, E. and Flikweert, J. (2019). Asset Performance Tools: Improving Defence Performance Curves Using Local Knowledge – Methodology.
CIRIA. (2013). The International Levee Handbook.
Morris, M., Dyer, M. and Smith, P. (2007). Management of Flood Embankments. A good practice review. R&D Techincal Report FD2411/TR1.
Rangitaiki River Scheme Review Panel (2017). Rangitaiki River Scheme Review – April 2017 Flood Event.